Just a few weeks ago, the stock market seemed to be pricing in a successful fight against inflation, excellent economic data and an AI revolution that would pay off in the near future (See April article). AI is real and the term ‘revolution’ is probably still justified. However, investors are slowly beginning to doubt whether the enormous investments made by many companies are economically worthwhile. At the same time, the economy as a whole is not doing as well as long assumed. The first signs of this, such as increasing consumer restraint, have actually been around for some time. However, it was only with the Fed meeting and fresh economic figures on Thursday and Friday that the mood changed - and how.
On Friday, Japan's Nikkei fell by over 5%, the second largest fall in history. The Nasdaq is now officially in a correction (10% from the high), the S&P500 is close to it. Some ‘Magnificent 7’ stocks lost over 20% from the high. The VIX volatility index has frequently been below 12 in recent weeks and temporarily jumped to almost 30 on Friday. Gold reaches a record high, oil falls to a 6-month low. And it almost looks as if it could go on.
The crash was triggered by weak economic figures. On Thursday, the July results of the ISM Manufacturing PMI (Purchasing Manager Index) came in, which at 46.8 were significantly worse than expected (48.8, see Chart 1). The ISM conducts a monthly survey of leading purchasing managers and asks them about their expectations for the future. Accordingly, the publication is often used as an indicator of future economic developments. American purchasing managers therefore expect the economic situation in the manufacturing industry to deteriorate. The results of recent months have also been below 50, the threshold between an upturn and a downturn. The figures for the service sector will be published next week.
Chart 1: USA Purchasing Managers' Indices (PMIs)

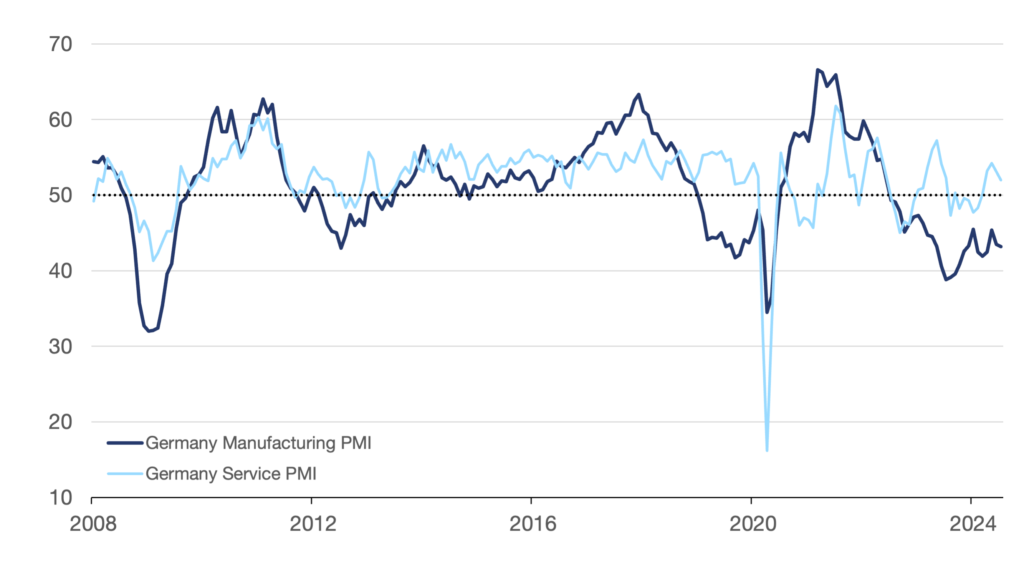
The situation is similar in Germany:
Chart 2: Germany Purchasing Managers' Indices (PMIs)
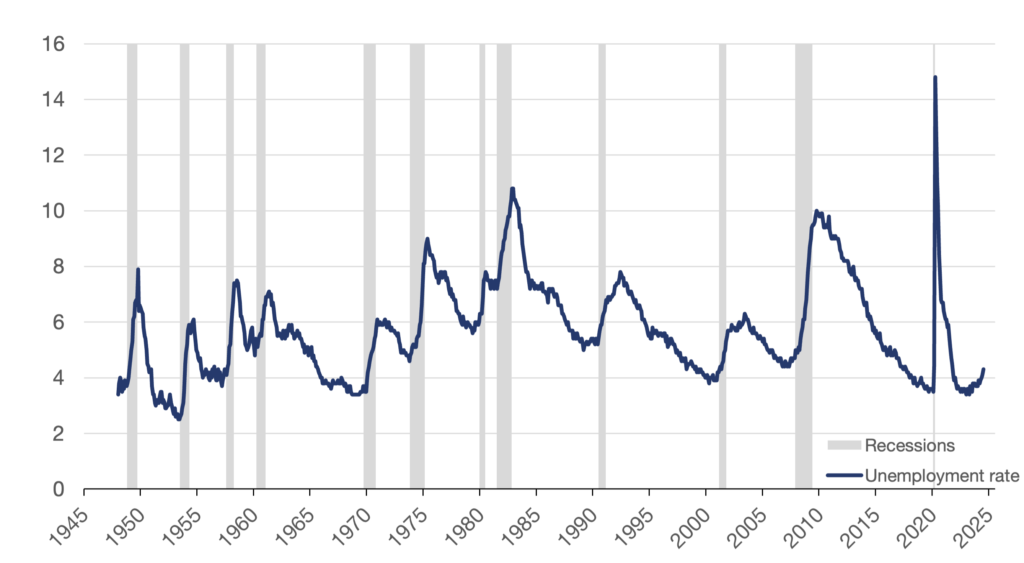
The results for the labour market were published on Friday. The labour market is considered a mirror of an economy, which is why changes are closely monitored. By historical standards, the US labour market is currently strong and unemployment is at a very low level of just over 4% (Chart 3). However, the unemployment rate surprisingly rose to 4.3% in July, which was higher than expected (4.1%). New job creation also fell short of expectations (114k vs. 175k expected).
Chart 3: USA unemployment rate
The deterioration in the unemployment rate triggered the much-noticed Sahm indicator. This indicator, developed by economist Claudia Sahm, is used to recognise the onset of a recession in the USA at an early stage. An increase in the three-month moving average of the unemployment rate by 0.50 percentage points or more compared to the minimum of the three-month averages of the previous 12 months is regarded as a signal.
Chart 4: The Sahm recession indicator
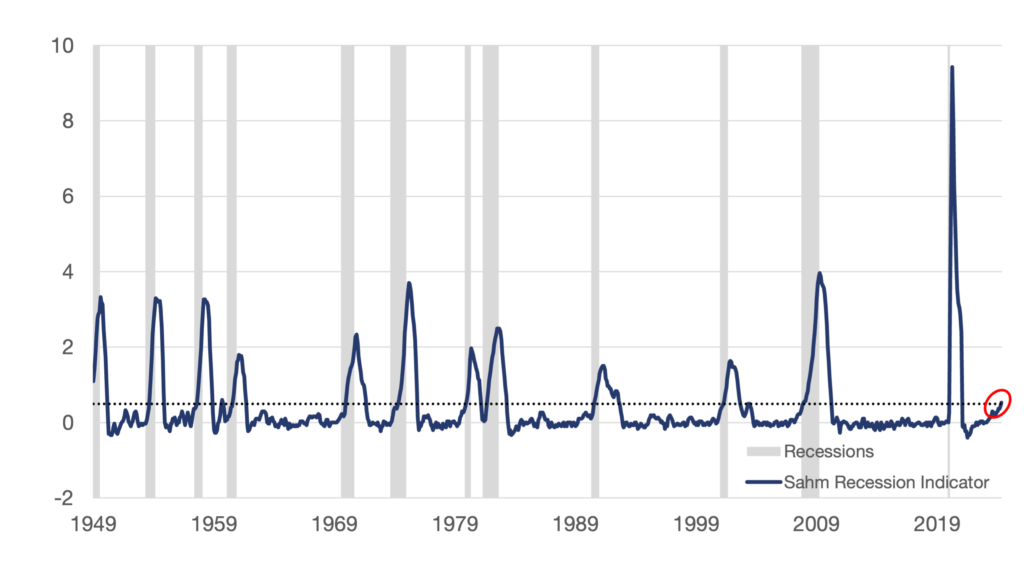
The main advantage of the Sahm indicator is its speed, as it can indicate an economic slowdown at an early stage, even before official economic figures such as gross domestic product (GDP) are published. A table from Bank of America illustrates its accuracy:
Chart 5: Sahm-Indikator sehr treffsicher
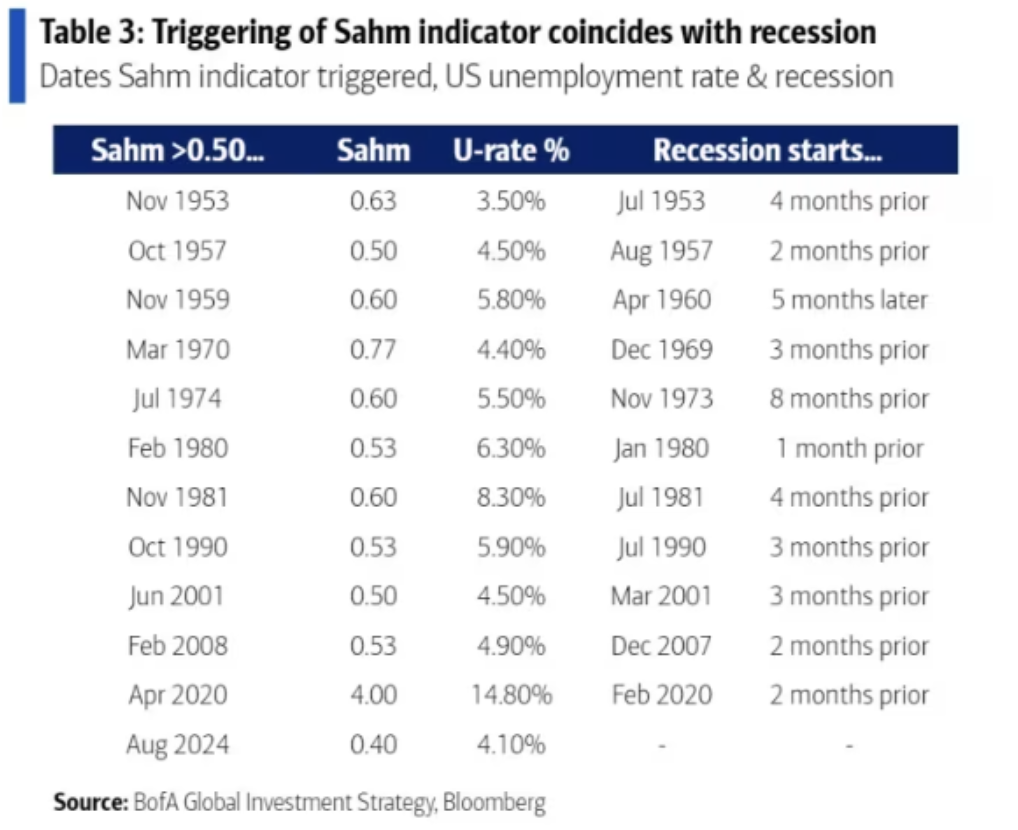
Nevertheless, the inventor herself urges caution and says that it could be a false signal due to the special situations in the coronavirus crisis. This is because many people were not classified as jobseekers due to the support programmes during the coronavirus crisis. If these people now re-enter the labour market and have not yet found a job, they will appear in the statistics and increase the number of unemployed.
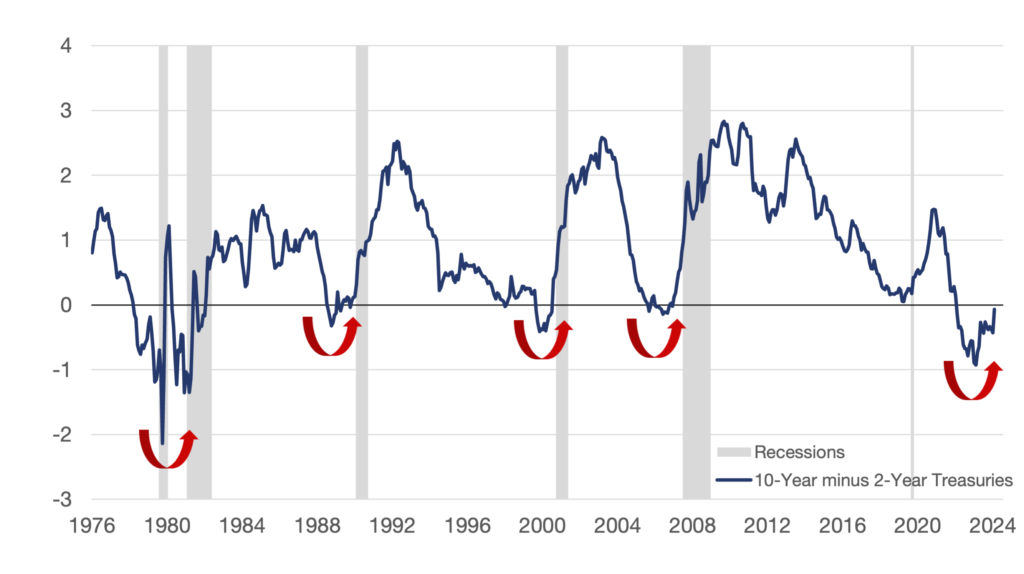
However, another well-known indicator is also signalling a recession - and has been for a long time: the inverted yield curve. When low interest rates are higher than long-term interest rates, a recession has often occurred in the past. The yield differential between two-year and ten-year US government bonds is usually used for this purpose (Chart 6). In particular, the steep rise out of an inversion was often a signal that a recession was imminent. It appears that we are currently experiencing this rise.
Chart 6: Goodbye inverted yield curve?
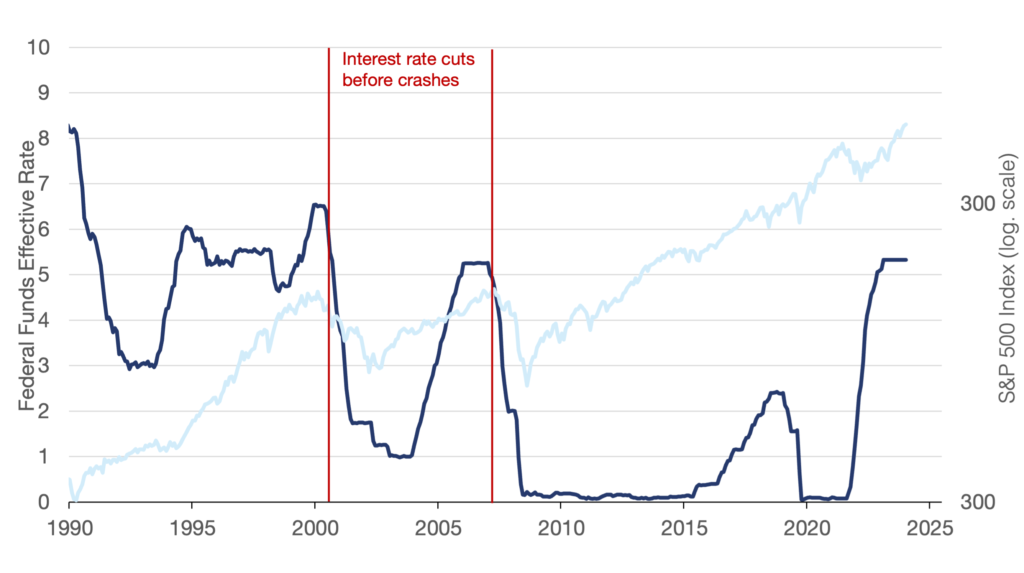
The market has already been assuming for some time that key interest rates will be lowered. Due to the threat of recession, three interest rate cuts in a row (September, November, December) are now being priced in. While falling interest rates are generally positive for the stock market, this is not always the case in combination with a recession. Although there have been recessions in which interest rate cuts were accompanied by rising share prices, in 2000 and during the financial crisis there were only major price losses after the cut.
Chart 7: Stock market crash possible despite interest rate cuts
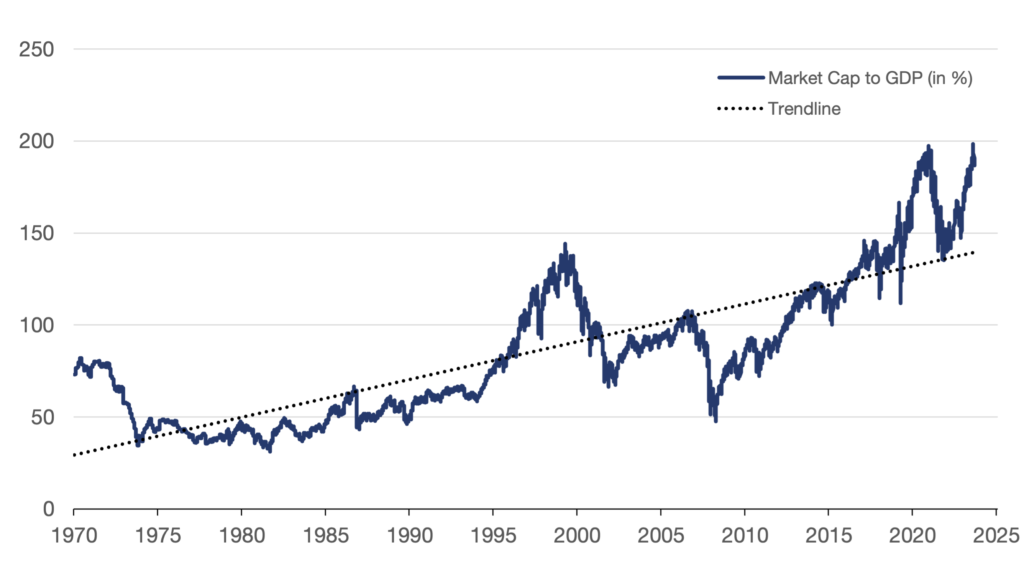
The current valuation of the US stock market also does not necessarily give us hope that a correction will not materialise. The ratio of the market capitalisation of American companies to gross domestic product, which Warren Buffett likes to refer to, is close to its peak.
Chart 8: Buffett indicator calls for caution
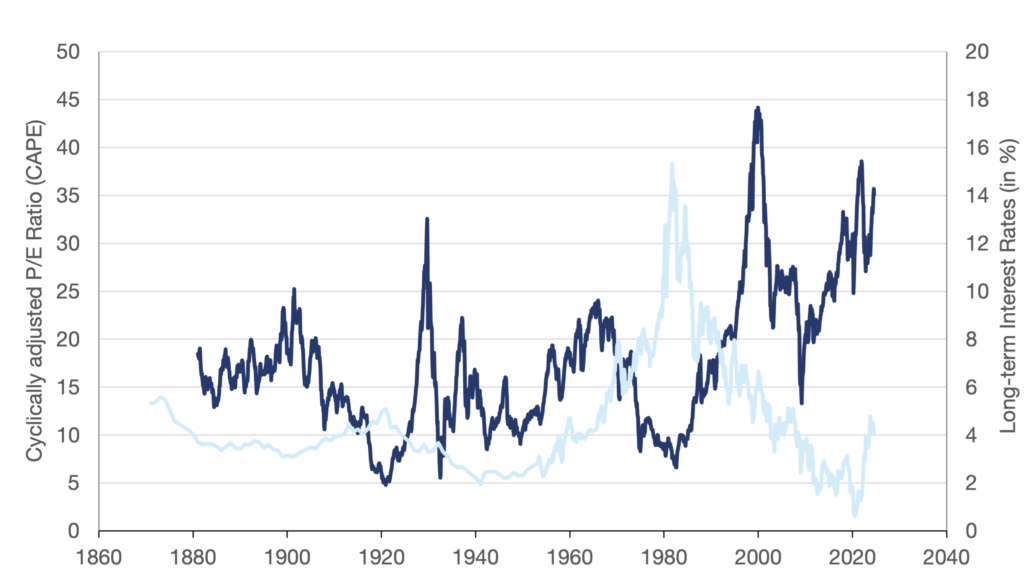
Robert Shiller's cyclically-adjusted P/E ratio, or CAPE for short, is also well above the historical average at around 35. Here, the market capitalisation is set in relation to the smoothed profits of the last 10 years. It is worth noting that interest rates have been at historically low levels over the past 10 years, which certainly favoured corporate profits during this phase. If one assumes that future profits will be somewhat lower due to higher interest rates, this would further increase the already high valuation.
Chart 9: Shiller CAPE: US equity market expensive
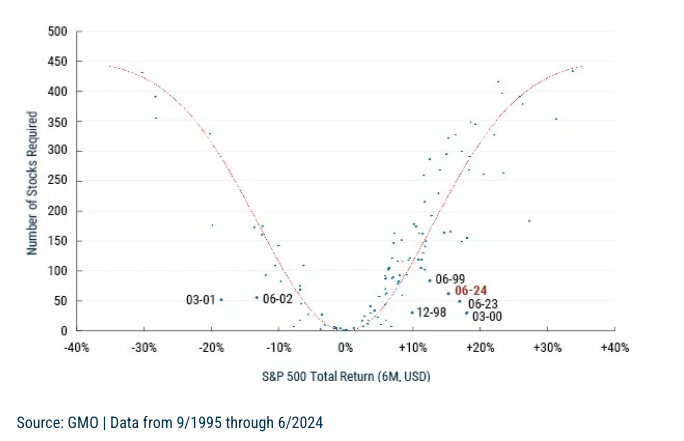
As already mentioned several times, a small number of large companies are currently the main price drivers on the US stock market. GMO recently published a chart showing how many shares are needed to explain the six-month return of the S&P 500 (January to June 2024). Based on past data, a 15% return would require several hundred stocks. This time, just over 50 shares were enough.
Chart 10: High concentration: How many stocks explain the 6-month return of the S&P 500?
Hope for the best, prepare for the worst
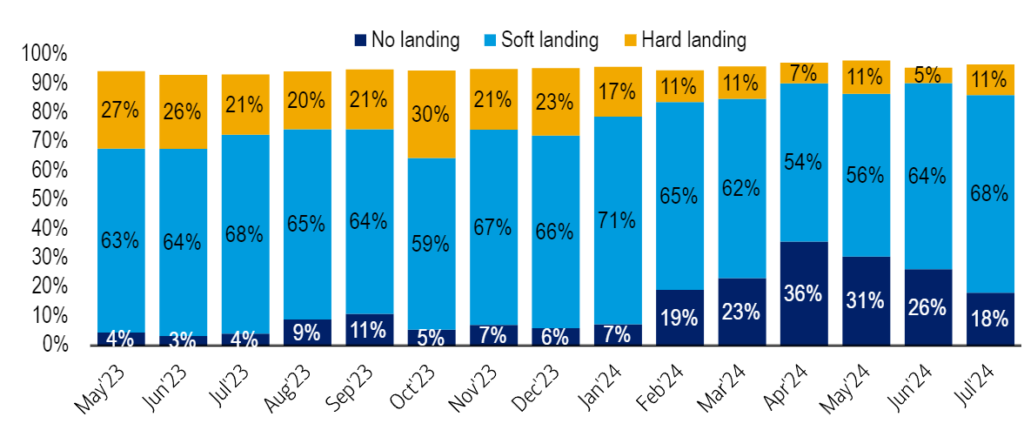
No indicator in the world can predict the future with certainty and, as the inventor of the Sahm rule herself says, there are always explanations and reasons why an indicator may give a false signal. Nevertheless, the indicators presented have their raison d'être, and ‘this time everything is different’ has often turned out to be an expensive assumption in the past. Just remember that the central banks and numerous experts only labelled inflation as ‘transitory’ for a very long time after the money glut of the coronavirus crisis. The error could now be similarly serious with the expected ‘soft landing’ or ‘lack of recession’. There have been fourteen interest rate hike cycles in the USA since the Second World War. Eleven of these ended in a recession. Only three times (1965, 1983 and 1994) did the soft landing succeed.
Chart 11: Optimistic expectations of market participants
It is therefore advisable not to blindly trust that the central banks will successfully perform the balancing act of fighting inflation and supporting the economy. Positive market expectations coupled with high valuations are an explosive mix. Investors can protect themselves from a crisis with stable equities and a good geographical mix. Above all, however, a high cash ratio makes sense in order to utilise times of crisis on the stock market anti-cyclically. Speaking of a high cash ratio: Warren Buffett's Berkshire Hathaway sold almost half of its Apple shares in the second quarter, increasing its cash by almost USD 80 billion to over USD 270 billion. This is now the seventh quarter in a row in which Buffett has sold more shares than he has bought. It seems that someone is not just expecting a summer storm.
Disclaimer: All information is at all times and without exception my personal opinion and judgement. No information, materials, services or other content provided on this website constitutes a solicitation, recommendation, endorsement or financial, investment or other advice. All information (forecasts, comments, hints, advice, etc.) is for educational and private entertainment purposes only. If visitors follow this advice, they act on their own responsibility.