First FAANG, then Magnificent Seven and now AI. Artificial intelligence is the narrative that has been driving the markets and economy since the end of 2022 - and has thus ended the market correction around the interest rate shock. On 30 November 2022, Open AI released the chatbot ChatGPT. The programme was classified within the company as a ‘low-threshold research preview’. Then all hell broke loose. Since then, AI has been real.
An example on a small scale: just recently, a client of our M&A consultancy replaced 50% of its customer service with the help of artificial intelligence. Not only did this work smoothly, but the quality was also a positive surprise. But AI is more than just an economic assistant. AI also paints pictures, composes songs and tells stories. It not only has the potential to shake up entire industries, but also raises completely new questions and sets new precedents. Hardly anyone shies away from parallels with the internet or even the industrial revolution. In short: AI is here to stay and will fundamentally change our world. Everyone agrees on that. But what does this mean for the stock market? Should investors still invest in AI shares now in order to participate in this revolution that was thought to be so certain? There is a good chance that this will result in anything but an earth-shattering performance.
A journey through historical narratives
History is full of narratives that have dominated the stock markets for years. Chart 1 shows prominent examples.
Historical overview
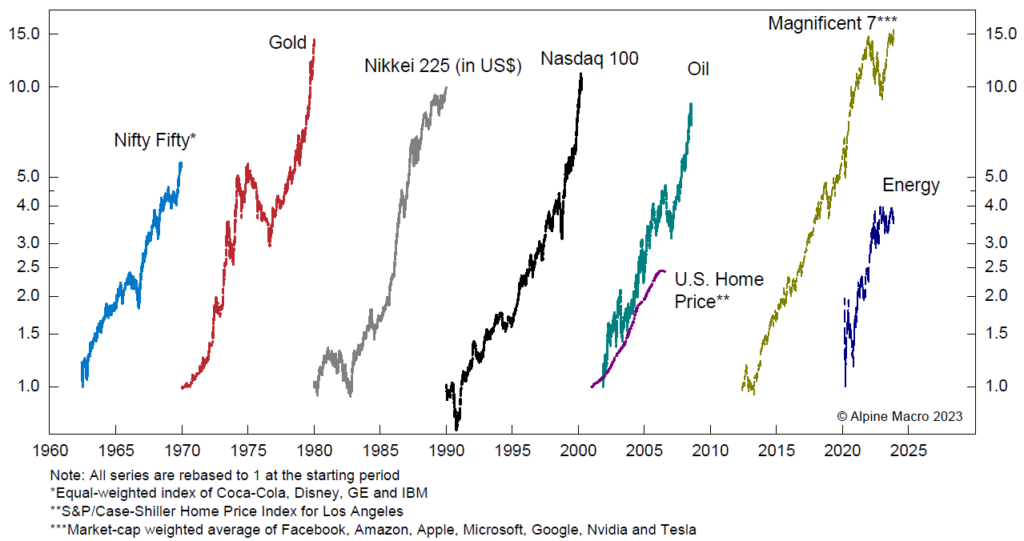
There were the Nifty Fifty companies, which were considered a sure-fire investment in the USA in the 1960s due to their dominant market position, solid balance sheets and high growth rates, and also benefited from fears of inflation. From 1980 onwards, Japan experienced a historic asset price development. The Japanese share index Nikkei rose from 6,867 to 38,915 points within 10 years. Japanese shares accounted for 45% of the global stock market (USA only 33%) and a single square metre in the Ginza shopping district cost 32 million yen, i.e. around 230,000 dollars. Japan seemed unstoppable - until prices finally collapsed. Gold and oil are two commodity narratives among the examples. Gold exploded in the 1970s after the gold standard was replaced in the USA and oil, then known as black gold, exploded in the early 2000s until the 2008 financial crisis. The main reason for this was the extreme demand from China.
An opposing narrative, i.e. anti-oil and pro-renewable energies, has been created in recent years and reached its peak during the coronavirus crisis. Driven by the climate crisis, (mostly unprofitable) shares from the renewable energy sector were cheered, while the oil price even reached USD 0 in the meantime and oil shares were avoided both proactively and for regulatory reasons. The other two narratives are also very similar. The dotcom bubble (Nasdaq 100 in this case) and the Magnificent Seven, which is still ongoing and is now largely continuing under the AI theme.
Parallels with the dotcom bubble
A comparison between the AI hype and the dotcom bubble around 2000 is becoming increasingly obvious. Back then, the clear narrative was that the internet would change everything and create a whole new sector of the economy - the new economy. Narratives have the advantage that they are mostly true, i.e. they actually materialise, but the disadvantage that they are often fully reflected in current share prices. Betting on a narrative is therefore not a particularly promising way to invest. The main mistake made here is to assume that the dominant companies today will still be the dominant companies in 10 years' time. Added to this are exorbitant valuations based on speculation that the companies in question will grow faster and, above all, more profitably than they actually do.
In the dotcom bubble, for example, some companies were valued at 100 times their earnings. These included companies that were to carry out cable expansion and were therefore regarded by investors as big winners. As we know today, little came of this hope. Many former favourites such as 360Networks, Pets.co, Webvan, Boo.com and eToys have gone bust. Others still exist, however, and Microsoft is one of them that is still a world leader today. But even with Microsoft, investors had to wait almost 15 years to see the highs from the dotcom bubble again. These examples show: Many of these companies were undoubtedly the dominant companies at the time and some still are. But all this was already included in the share price. To be successful with such an investment, these companies have to perform better than the underlying narrative suggests. Difficult when everything already seems to be overshadowed by this.
IT sector: weighting and valuation premiums at historic levels
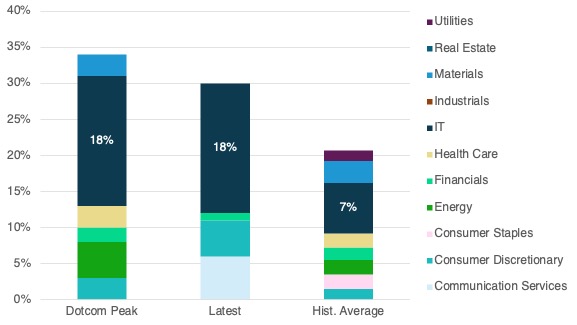
The sector weighting of the top 10 stocks in the MSCI USA (Chart 2) shows just how powerful the narrative is. The quant team at J.P. Morgan took a look at the top 10 stocks in the MSCI USA and their sector breakdown and weighting in the overall index and compared them with the dotcom bubble. In general, it is noticeable that only four different sectors are represented among today's top 10 stocks. During the dotcom bubble, there were six sectors. In addition, tech stocks within the top 10 currently make up 18% of the entire index, just as they did during the dotcom bubble. The historical average is only 7%. Whilst it can certainly be argued that the IT sector has gained in importance historically and that the comparison with the historical average is therefore not accurate, the high proportion nevertheless calls for caution.
Sector weighting of the top 10 stocks in the MSCI USA
The main drivers in the IT sector are once again the index heavyweights. The IT overweight and thus also the AI narrative is driven by relatively few companies. Chart 3 shows that over 32% of the market capitalisation of the S&P 500 comes from the top 10 companies (84th percentile). According to J.P. Morgan, the speed of this increase is unprecedented in the last 60 years.
Weight of the top 10 stocks in the S&P 500 at a decade high

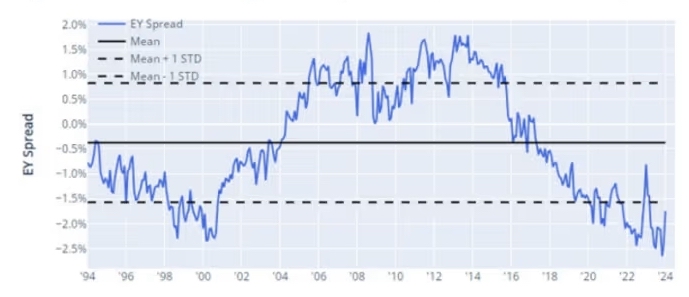
Equally impressive is the valuation premium that investors are currently paying for the 10 largest shares. The team took a closer look at the MSCI USA Index (609 US stocks) (Chart 4). The focus was on the inverse of the forward price/earnings ratio, the so-called forward earnings yield (e.g. P/E ratio of 12 -> EY: 1/12, i.e. 8.3%) for the top 10 stocks compared with the forward earnings yield of the remaining 599 stocks in the index. The result: the yield premium that investors are currently paying for the top 10 shares compared to the other stocks in the index is historically high and at a level comparable to 2000.
Forward earnings yield premium
Changing economic environment: How much longer will the tech giants continue to soar?
Trends often last longer than expected. And while they are running, those who stick with them earn money. So there is a real risk of missing out if you reject a narrative too early. This is particularly true when company figures surprise on the upside and the economy plays along. In addition, the broad market, i.e. not just the index heavyweights, has risen more strongly in recent months. At the same time, these heavyweights have dominated for quite some time. There are probably many reasons for this.
The highly profitable business models and years of strong growth must be recognised without envy. The fact that these companies have dominated the market for well over 15 years, longer than the index heavyweights have historically, can certainly be explained by the fact that many business models are actually new and the companies operating in them, such as Alphabet, Meta, Amazon and Apple, have monopoly or at least oligopoly-like structures. They therefore have the moat that so many investors are looking for. They are also extremely efficient and well-managed and have a strong shareholder orientation (e.g. through share buybacks).
However, part of the truth is probably also that the dominance is occurring at a time when there have been strong macroeconomic tailwinds. Key interest rates have fallen almost across the board since the financial crisis and central banks have fired up the printing presses to overcome the crisis (euro crisis, Covid, etc.), thereby increasing the ever cheaper money - to an almost unprecedented extent. The financial injections to overcome the coronavirus crisis were certainly the tip of this monetary policy iceberg. The combination of money supply growth and falling interest rates has given investors, particularly in the USA, a brilliant return. The beneficiaries have been the market as a whole, particularly in the form of ETFs, which - and this is an added bonus - have achieved almost unbelievable growth as investment vehicles themselves during this period.
All the money is therefore flowing into the major share indices, which are largely weighted according to market capitalisation, partly due to a lack of alternatives (bonds did not generate any interest). Accordingly, the largest companies (USA and then the top 10) also receive the most inflows, which drives the game forward. The inflation-driven turnaround in interest rates, which was also historic in its speed, and the decline in the money supply have triggered a full monetary policy brake. Higher inflation, rising interest rates and less money in the economic system are particularly detrimental to highly valued growth companies, as investors now expect a higher return on future profits than in the past (higher interest rates). We got a taste of what this can mean for the financial markets at the end of 2022 - until the aforementioned emergence of the AI hype.
The stock markets seem to be assuming the ideal scenario (inflation under control, slightly falling interest rates and solid growth) due to the good economic data and corporate figures. However, as soon as inflation surprises to the upside or downside and companies - especially in the AI & tech sector - are no longer able to fulfil investors' high expectations, things are likely to get gloomy quickly. The market seems carefree and companies driven by the AI narrative are celebrated. If history is any guide, then it should only be a matter of time before this changes. Underperformance by the dominant US companies will then also be the undoing of passive investors, who often take an unexpected cluster risk with supposedly broadly diversified ETFs(see article).
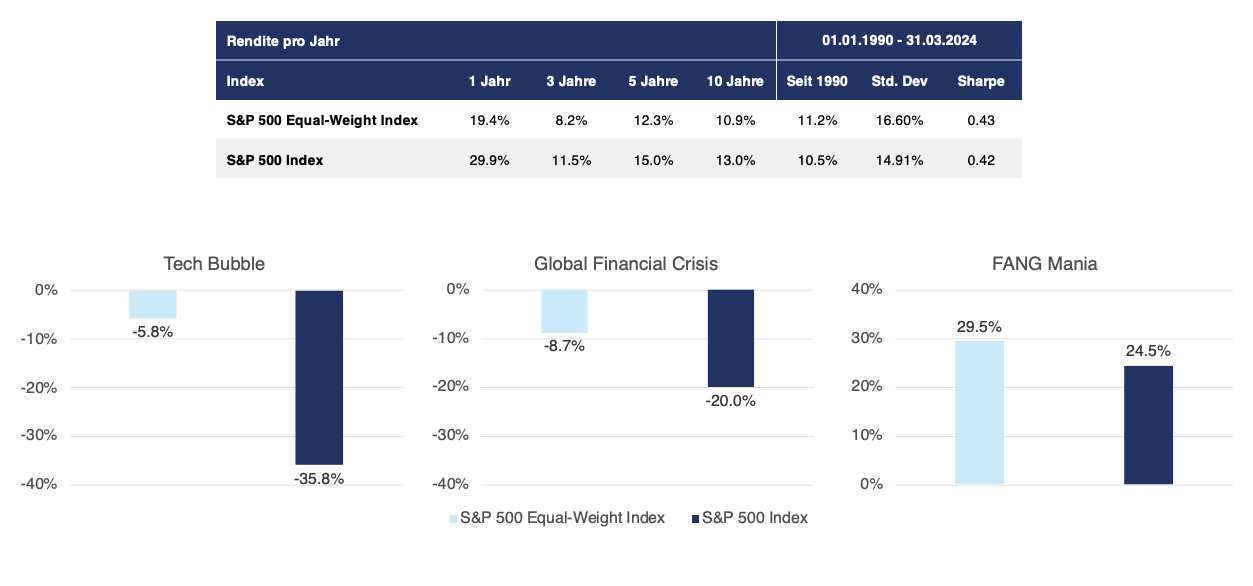
For investors who want to protect themselves against this and still remain (passively) invested, equally weighted indices that are reasonably diversified in terms of sector and geography are a good way to reduce exposure to the index heavyweights, the US and the tech sector. Many equal-weighted indices have outperformed over the long term and have also done relatively well in times of crisis (S&P500 in Chart 5).
Equal-weighted S&P 500 Index
Disclaimer: All information is at all times and without exception my personal opinion and judgement. No information, materials, services or other content provided on this website constitutes a solicitation, recommendation, endorsement or financial, investment or other advice. All information (forecasts, comments, hints, advice, etc.) is for educational and private entertainment purposes only. If visitors follow this advice, they act on their own responsibility.